Here’s a very specific kind of person this post is for. You’ve thought about data analytics as a career more than once. Something about it genuinely appeals to you: working with real information, finding patterns, actually understanding what’s going on inside a business instead of guessing. But every single time you get close to looking into it seriously, one thought stops you cold. “I was never good at math. This isn’t for me.”
Take a breath, because that thought is doing a lot more damage than it deserves to.
This isn’t going to be another article telling you math is secretly fun if you just give it a chance. It’s not; let’s be honest about that instead of pretending otherwise. What this post actually does is answer, specifically and honestly, how much math is required for data analytics, whether you can pursue data analytics without advanced math, and why Python for data analytics beginners makes the learning curve less intimidating than most people expect.
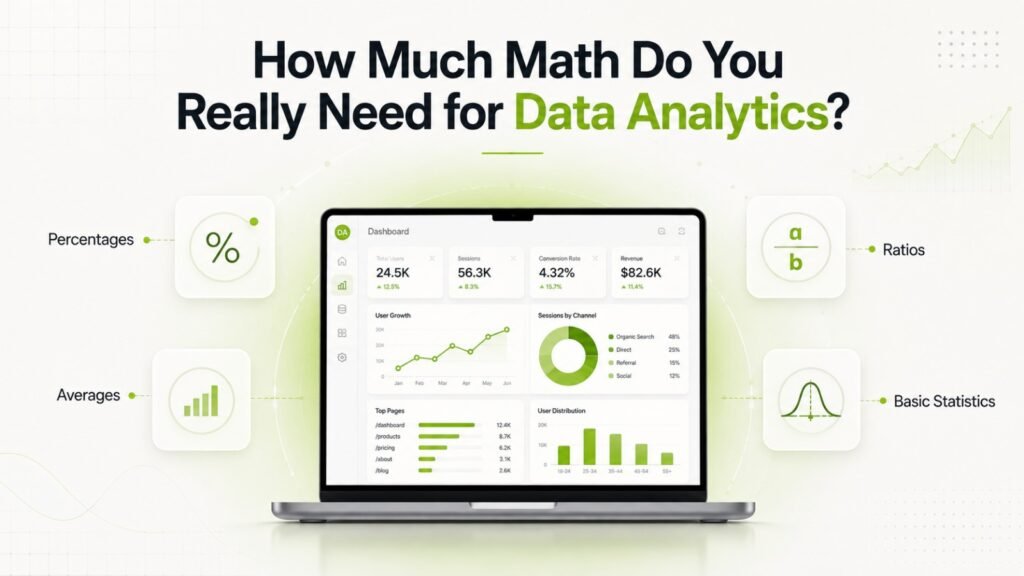
Quick Answer: Is Math Required for Data Analytics?
No. Not in the way school made you fear, anyway. Most entry-level data analytics work leans on high school-level math and basic statistics, things like averages, percentages, and spotting trends, not calculus, not advanced algebra, not the stuff that made you want to disappear during a math exam. Python removes much of the manual calculation, but you still need enough math and statistics to interpret the results correctly. Your actual job becomes asking good questions and making sense of results, not solving equations by hand.
What Math You Actually Use in Real Data Analytics Work
Let’s get specific here, because vague reassurance is exactly what got you skeptical in the first place.
Day to day, a data analyst mostly works with basic statistics. Averages. Percentages. Understanding whether a number is going up or down and by how much. There’s some pattern recognition involved too, noticing that sales dip every Tuesday, or that one region consistently outperforms another. And when formulas do show up, you’re almost always using them inside a tool, typing a function name, not deriving the math behind it from scratch on paper.
Now compare that to what actually scared you off in school. Calculus. Trigonometry. Long algebraic proofs where one wrong step early on wrecks the whole answer. Here’s the honest gap nobody points out clearly enough: that fear and this job barely overlap. So do you need to be good at math for data analytics in the way your school report card measured it? Not really, no.
What Math Should You Learn Before Data Analytics
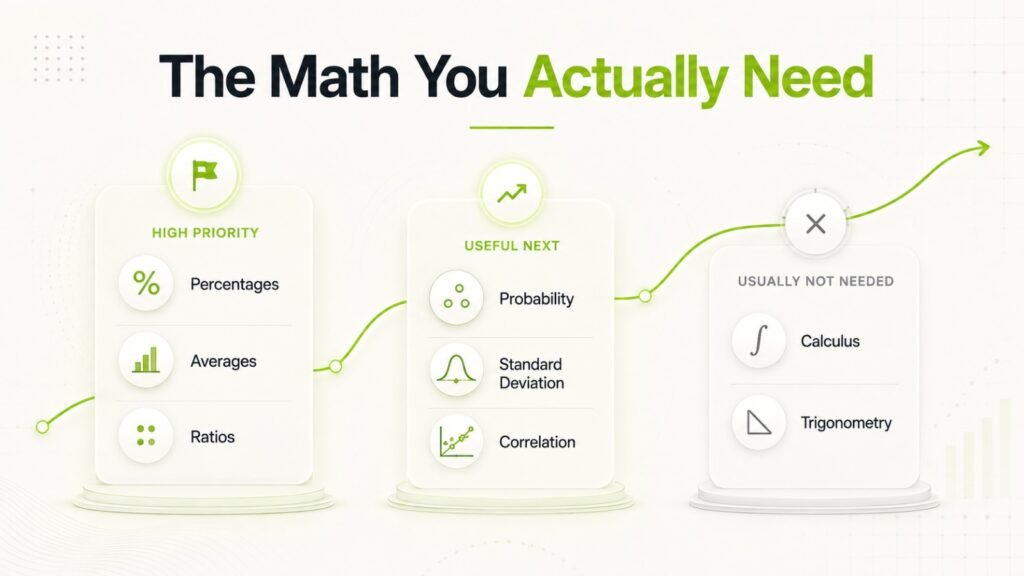
You don’t need to relearn your entire school mathematics syllabus before starting data analytics. Focus on the few concepts you’ll actually encounter when working with data.
| Math Topic | How Important Is It? | Where You Might Use It |
| Percentages | High | Growth, conversion rates, margins |
| Averages & median | High | Sales, salaries, customer data |
| Ratios | High | Comparisons and business metrics |
| Basic probability | Medium | Risk and uncertainty |
| Standard deviation | Medium | Understanding data spread |
| Correlation | Medium | Finding relationships between variables |
| Basic algebra | Basic | Working with formulas and variables |
| Calculus | Usually not needed for entry-level roles | More relevant to advanced modelling |
| Trigonometry | Usually not needed | Rarely relevant to typical analyst work |
You don’t need to master all of these before you begin. Start with percentages, averages, ratios, and basic statistics. As you work with real datasets, concepts like standard deviation, probability, and correlation will become much easier to understand in context.
The Math You’re Scared Of vs the Math You’ll Actually Use
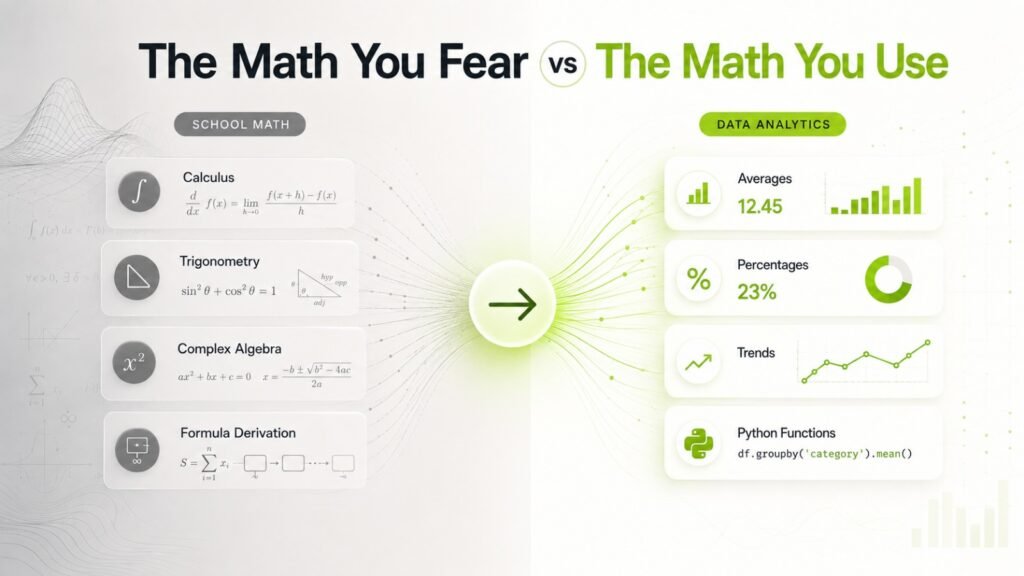
Seeing it side by side probably makes this land better than another paragraph of me telling you it’s fine.
| What You Probably Fear | What You Actually Use |
| Calculus and derivatives | Basic averages and percentages |
| Trigonometry | Simple counting and grouping |
| Complex algebraic proofs | Reading a chart or a trend |
| Manual formula derivation | Calling a built-in Python function |
| Advanced statistics theory | Basic distributions, explained visually |
Look at that left column for a second. That’s genuinely what scared most people off math in school. Now look at the right column. That’s what actually shows up in a typical day as a data analyst. For many entry-level data analyst roles, most of the topics in the left column aren’t part of everyday work. That gap is the whole point of this post.
Why Python Specifically Removes Most of the Math Burden
Here’s where this gets genuinely different from the usual “math is more approachable than you think” pep talk, because Python doesn’t just make math feel friendlier; it actually removes most of it from your plate entirely.
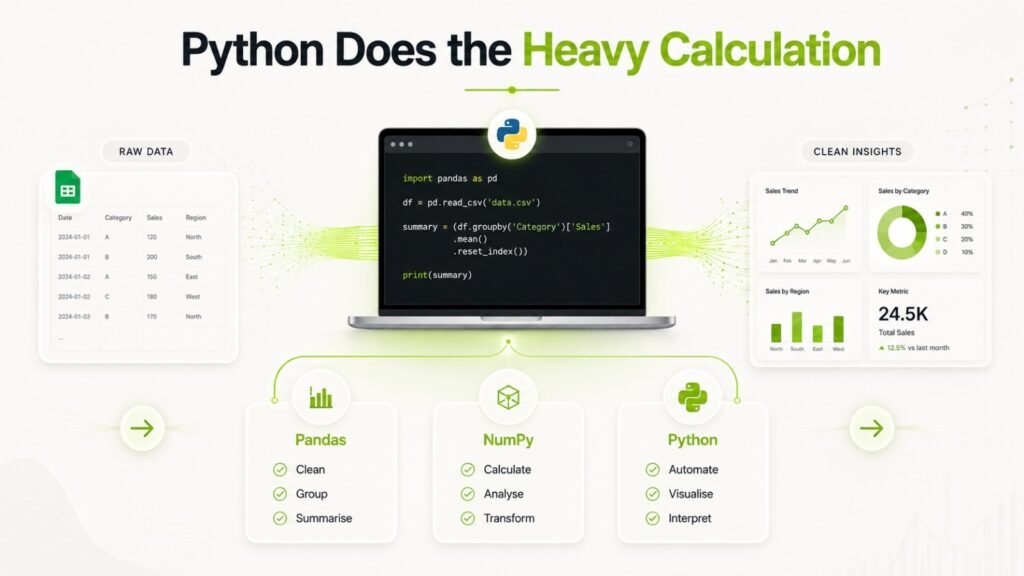
Pandas, one of Python’s most widely used libraries, handles data manipulation for you: sorting, filtering, grouping, summarizing. NumPy takes care of numerical operations behind the scenes. Built-in functions calculate averages, standard deviations, and all sorts of statistics without you ever writing the underlying formula yourself. Your actual skill becomes knowing which function to reach for and why, not deriving it from first principles the way a math textbook would make you.
This isn’t just FirstBit’s opinion either. Google’s own Data Analytics Certificate program states this plainly: no prior experience with spreadsheets or analytics is required, and high school-level math is genuinely enough to succeed. That’s coming from Google, a company that hires actual data analysts for a living, not just a training institute trying to make you feel better.
A Realistic Example: What “Doing Math” in Python Actually Looks Like
Talking about this abstractly only goes so far, so let’s actually look at it.
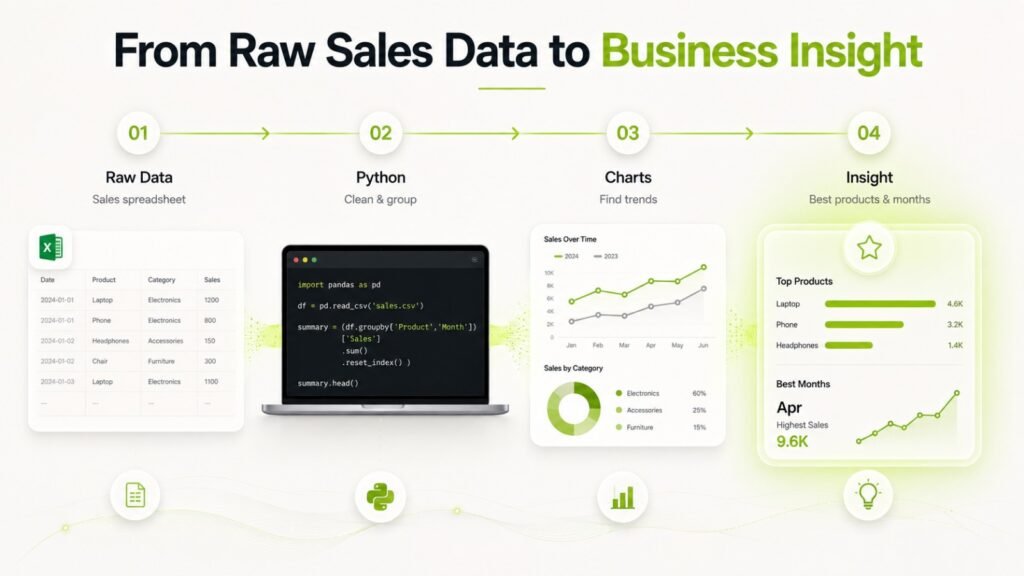
Say you have a spreadsheet of sales data and you want to know the average sale amount. Doing that by hand means adding up every single number and dividing by how many there are, tedious and genuinely error-prone once you’re past a handful of rows. In Python, using Pandas, that’s one line of code, something like data[‘sale_amount’].mean(). One line. Python does the adding and dividing instantly, and hands you the answer.
Want to know which month had the highest sales? Also roughly one line, grouping your data by month and asking for the maximum. No manual comparison, no sitting there with a calculator cross-checking twelve different totals. This is the actual, concrete difference between the math you’re afraid of and the “math” you’ll really be doing. You’re not solving equations. You’re asking Python the right question and reading the answer it hands back.
Curious what this actually feels like in practice, beyond just reading about it? Book a free demo class and watch a real walkthrough before deciding anything.
What a Realistic First Project Actually Looks Like
Reading about one-line functions is one thing. Seeing how they string together into something real is what actually builds confidence, so let’s walk through a small, believable first project.
Imagine you’re handed a spreadsheet of a small shop’s sales for the past year. Your job is to figure out which products sell best, whether sales are trending up or down, and which month was strongest. None of that requires a single formula you’d recognize from a math textbook. You’d load the data into Python using Pandas, group it by product to see totals, group it again by month to spot the trend, and use a simple chart to make the pattern obvious at a glance. Every step is a short, readable line of code asking a specific question, not a calculation you’re solving by hand.
By the end, you’d have real answers, backed by real numbers, without ever touching anything that resembles the math that scared you off years ago. That’s genuinely what a first project in this field looks like, and it’s a lot closer to detective work than it is to a math exam.
How Long Before the Math Fear Actually Fades?
This is worth answering honestly too, since vague timelines help nobody.
For many beginners, the fear starts fading once they actually work with a few datasets, not because the math got easier, but because they realize how rarely it actually shows up. The first week or two usually still carries some of that old school-era anxiety; old habits are hard to shake. By the time you’ve written a handful of real functions yourself, averaging a column, grouping data, building a simple chart, the fear tends to quietly fade, replaced by the much more ordinary feeling of “oh, this is just typing the right word in the right place.”
Consistency matters more here than natural talent ever did. Someone who practices a little bit regularly will get comfortable faster than someone waiting to suddenly feel “ready” for it, which, if you’re being honest with yourself, is probably part of what kept you circling this decision for as long as you have.
Data Analyst vs Data Scientist, Which Needs More Math?
Worth being straight about this too, since the two titles get confused constantly. Data analysts typically use less advanced mathematics than data scientists, especially in entry-level roles. Data scientists working with machine learning, modelling, and statistical methods usually need a stronger foundation in statistics, probability, and mathematics. Analysts focus on explaining what’s already happened in the data, spotting trends, building dashboards, and answering business questions. Data scientists go further, building predictive models, which leans much more heavily on statistics and sometimes genuine machine learning math.
The exact math requirements also depend on the analyst role. A marketing or business analyst may spend most of their time working with percentages, averages, trends and dashboards, while roles involving experimentation, forecasting or advanced modelling can require stronger statistics. So “data analyst” isn’t one single job with one fixed level of math.
If you’re specifically worried about math, data analytics is the friendlier of the two paths by a real margin, not just a marketing line. We’ve actually covered the fuller comparison between these two roles, including the tools and typical career paths for each, over here: Data Analyst or Data Scientist: How to Pick Your Lane. Worth a read if you’re still deciding which direction genuinely fits you.
Common Fears That Aren’t Actually True
A few things worth clearing out directly, because they’re doing more damage than people realize.
“I failed math in school, so this field isn’t for me.” Not true, and honestly, this one comes up constantly. Plenty of working data analysts weren’t math prodigies in school. What actually matters here is curiosity and consistency, not a childhood report card.
“Data analytics is basically applied calculus.” Also not true, at least not for the vast majority of entry-level and even mid-level roles. You’ll go long stretches without touching anything resembling calculus.
“Python requires a strong math background to learn.” Genuinely not true. Python’s syntax reads close to plain English, and plenty of people with weak math backgrounds pick it up faster than people who were “good at math” but never learned to code.
“Is Python hard for data analytics if I’ve never coded before?” Not especially, and this fear usually has nothing to do with math at all, it’s really a fear of programming itself. Python was specifically designed to be readable, and most beginners find the syntax far friendlier than they expected, math background aside.
One more thing worth saying plainly, since it’s the fear underneath most of the others: data analyst math skills required for the job are genuinely modest compared to what a school curriculum puts you through. The gap between “what scared you in school” and “what this job actually asks of you” is bigger than almost anyone realizes until they actually see it laid out, which is exactly what the table above was for.
How FirstBit Approaches This for Students Who Are Worried About Math
Because this exact worry comes up so often, our Data Analytics program is built to ease people in gradually. We start with practical tools, not theory-heavy math lectures, so confidence builds through actually doing the work, not sitting through equations first. If you’ve been searching for a data analytics course in Pune or a Python for data analytics course in Pune, this is usually exactly the concern sitting underneath that search, and it’s the specific gap the program is built to close.
And if even Python feels like too big a first step right now, that’s a completely reasonable place to start slower. Our Excel and Power BI course is a genuinely gentler entry point into working with data, more visual, more familiar, and honestly a natural stepping stone toward Python later once the underlying concepts feel comfortable. Nobody has to jump straight to code on day one, and that’s true whether you’re a complete beginner or someone specifically nervous about Python for beginners with no math background holding you back.
Final Thoughts
If a bad relationship with math from school is the only thing that’s kept you from exploring data analytics, it’s genuinely worth knowing that’s not the barrier it feels like from the outside. The math data analysts actually use day to day is a small, practical slice of what scared you off years ago, and Python specifically hands most of the remaining computation to a few lines of code instead of your own hand.
See our Data Analytics course details and see exactly how the program is structured for people starting from precisely where you are right now.
If you want to build these Python skills with a trainer and a set schedule, see the Python course with Data Science and AI in Pune.