
So you’ve decided data analytics is the path for you. Good call. Then you open a tutorial, a job portal, or a course syllabus, and there they are again: Power BI and Tableau, sitting side by side like they’re competing for your attention.
If you’re a fresher, a graduate, or someone switching careers in Pune, the question is real. Which one do you start with when you only have so much time and money to spend?
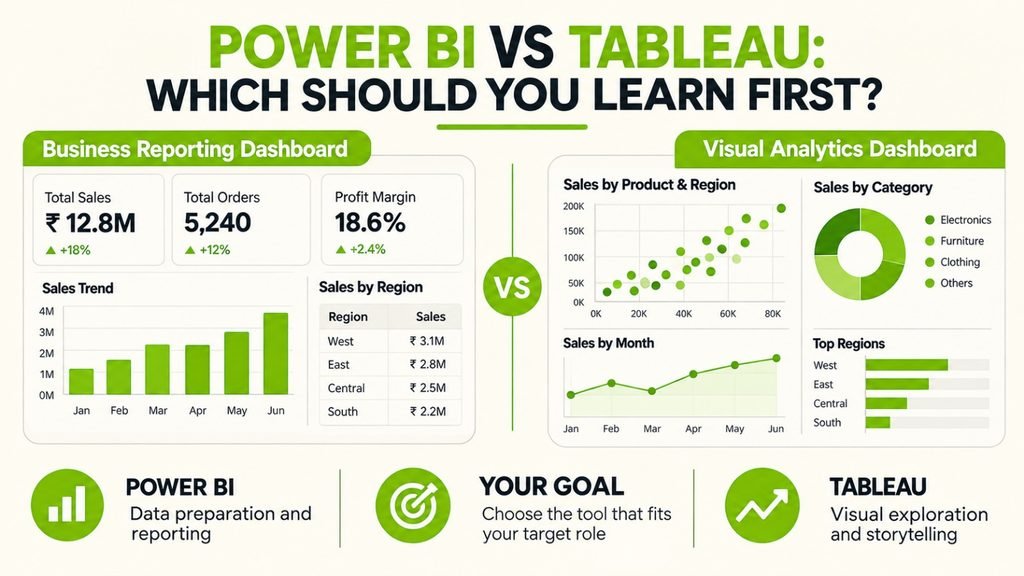
Here’s the quick, honest version. Power BI is a practical first pick for a lot of beginners, especially if you already feel at home in Excel. Tableau is a great choice if you love exploring data visually. The right answer depends on the kind of work you want to do, and we’ll sort that out together below, in plain language.
Power BI vs Tableau: Which Should You Learn First?
The short answer:
- Start with Power BI if you want to get into data preparation, data modelling, business reporting, and interactive dashboards, especially in workplaces that run on Microsoft tools.
- Start with Tableau if what excites you most is exploring data visually, spotting patterns, and presenting them clearly.
- Learn both if the jobs you’re targeting ask for both.
Now, a friendly reality check. Neither tool makes you job-ready all by itself. Plenty of people learn a tool and still struggle in interviews because the basics were shaky. SQL, Excel, cleaning messy data, thinking analytically, and explaining your findings to someone who isn’t a data person matter just as much. The tool is how you show the skill; it isn’t the skill.
So if you’re asking “should I learn Power BI or Tableau ?”, think of it as choosing which door to walk through first. You can always come back for the other one.
What Is the Difference Between Power BI and Tableau?
Before comparing them, let’s get clear on what each one actually is.
What Is Power BI?
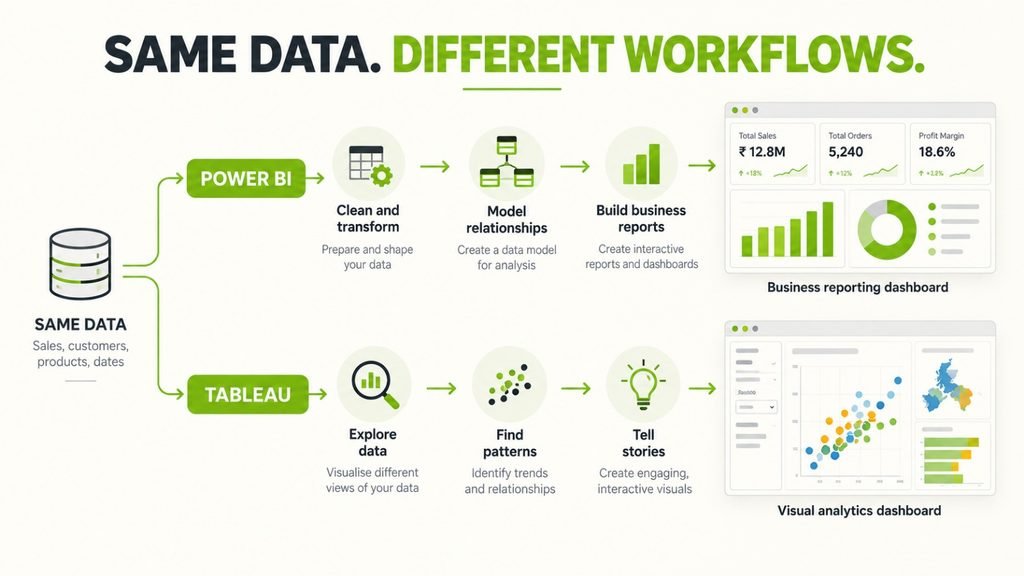
Power BI is Microsoft’s business intelligence tool. You connect it to your data (Excel sheets, databases, online sources), clean and shape that data, build relationships between tables, and turn it all into interactive reports and dashboards you can share with others.
Two names you’ll hear a lot: Power Query, which handles cleaning and preparing your data, and DAX, the formula language you use for calculations. Don’t worry about DAX yet. You pick it up gradually, one measure at a time.
What Is Tableau?
Tableau is an analytics platform built around visual exploration. You drag fields onto a canvas, see charts form instantly, and keep asking questions of your data until patterns show up. Then you pull your best views together into dashboards that tell a clear story.
Here’s an everyday example. Say a retail business in Pune wants to know how sales moved month by month, which product categories are doing well, and which stores are falling behind. Both tools can answer all of that. The route you take to get there just feels a bit different in each one.
Power BI vs Tableau: Feature-by-Feature Comparison
This is the part most people scroll to, so here’s a side-by-side view.
| Factor | Power BI | Tableau |
| Main strength | Business reporting, data modelling, interactive dashboards | Visual exploration and interactive visual analytics |
| What you’ll focus on learning | Power Query, data models, DAX, report design | Visual analysis, calculations, filters, dashboard design |
| Microsoft connection | Works closely with the Microsoft ecosystem | Connects to a wide range of data sources and platforms |
| Visuals | Flexible, interactive reports and dashboards | Flexible, with a strong focus on visual exploration |
| Getting started | Power BI Desktop is free for building reports | Tableau Desktop Free Edition is available for local analysis and authoring |
| Sharing your work | Online sharing and collaboration depend on licensing and capacity | Tableau Cloud, Server, and Public each have their own sharing options |
| Best way to begin | Start with data prep, modelling, and business questions | Start with visual analysis, calculations, and dashboard storytelling |
Licensing and pricing change from time to time, so before you commit to anything, check the official Microsoft Learn documentation for Power BI and Tableau’s own pricing and free-edition pages.
The big takeaway from the table: Power BI leans toward the data-prep-and-reporting side of the work, while Tableau leans toward the exploring-and-showing side. Real jobs mix both, so don’t treat this as a rigid divide.
Which Is Easier to Learn for Beginners: Power BI or Tableau?
Honestly, neither is easy for everyone, and neither is hard for everyone. It depends on where you’re coming from.
Learning Power BI as a Beginner
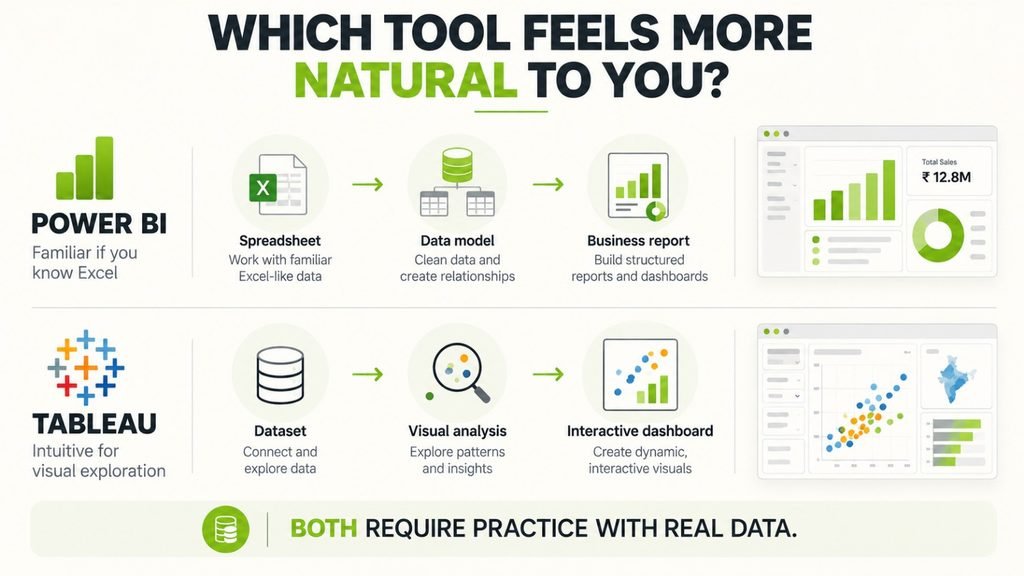
If you’ve spent time in Excel, a lot of Power BI will feel familiar. You import data, clean it up, create relationships between tables, write simple DAX measures, and build your report. The part that takes some getting used to is data modelling and DAX, but it clicks faster than you’d think once you’ve built a couple of reports.
Learning Tableau as a Beginner
Tableau gets you to your first chart quickly. You connect to a dataset, pick a sensible chart type, build calculated fields, add filters, and put together an interactive dashboard. The tricky bit is learning which visualisation actually answers your question, and that only comes with practice.
Your background matters here. If you’re comfortable with Excel formulas, Power BI may feel natural. If you’ve worked with databases, either tool could feel easy. And if you’re a visual thinker, Tableau might win you over fast.
My honest tip: take one small dataset and try both tools for an hour each. You’ll learn more from that than from any screenshot comparison.
Power BI vs Tableau for Data Analyst Jobs in Pune
This is probably what you really want to know. Which one will help you get hired in Pune?
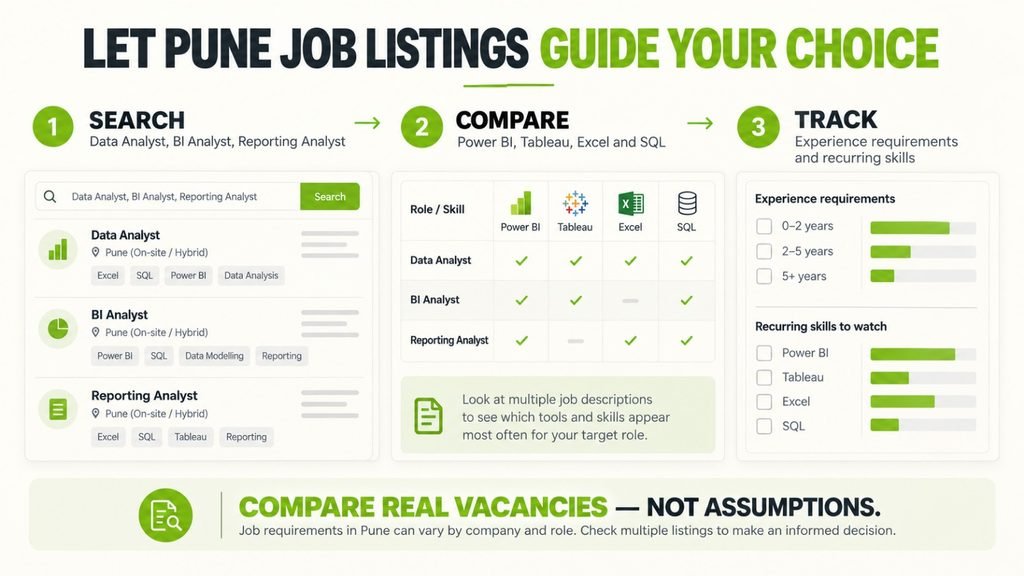
Here’s the straight answer: it depends on the specific job. Reporting, dashboard building, data preparation, and business analysis work can use either tool, and different companies have different preferences. Anyone who tells you one tool wins everywhere in Pune is guessing.
What works better is doing a little detective work yourself:
- Search for roles like Data Analyst, BI Analyst, Reporting Analyst, and Power BI Developer.
- Read the actual responsibilities, not just the title.
- Look at which tools come up: Power BI, Tableau, Excel, SQL, DAX, data modelling.
- Check how much experience each job asks for. Entry-level roles and experienced BI roles often look quite different.
Then open a notebook or spreadsheet and note down the date, job title, company, experience level, and tools listed for a decent number of recent Pune openings. After a week or two, you’ll see your own pattern, based on real postings instead of someone’s opinion. That’s far more useful than any claim you’ll read online.
If you’re also trying to understand what these roles might pay, read our guide to salary after a Data Analytics course in Pune for a more realistic look at salary expectations and the skills that can influence them.
Is Power BI or Tableau Better for Your Career Goals?
Let’s make this personal.
Choose Power BI First If…
- You already use Excel or other Microsoft tools at work or college.
- You want to practise business reporting and data modelling.
- The jobs you’re eyeing mention Power BI, DAX, or Microsoft-based reporting.
Choose Tableau First If…
- The roles you’re targeting specifically ask for Tableau.
- You want to build your visual exploration and dashboard storytelling skills.
- You’d like a public portfolio on Tableau Public. Just remember that anything you publish there is visible to everyone, so never upload confidential data.
Should You Learn Both Power BI and Tableau?
Eventually, maybe. But trying to learn both at the same time usually leaves you with half-knowledge of each. Pick one, learn it properly, and finish a real project in it. Once you understand data prep, calculations, chart choice, and dashboard design, those ideas travel with you. Picking up the second tool later feels much less scary.
How to Practise Power BI and Tableau With Real Data
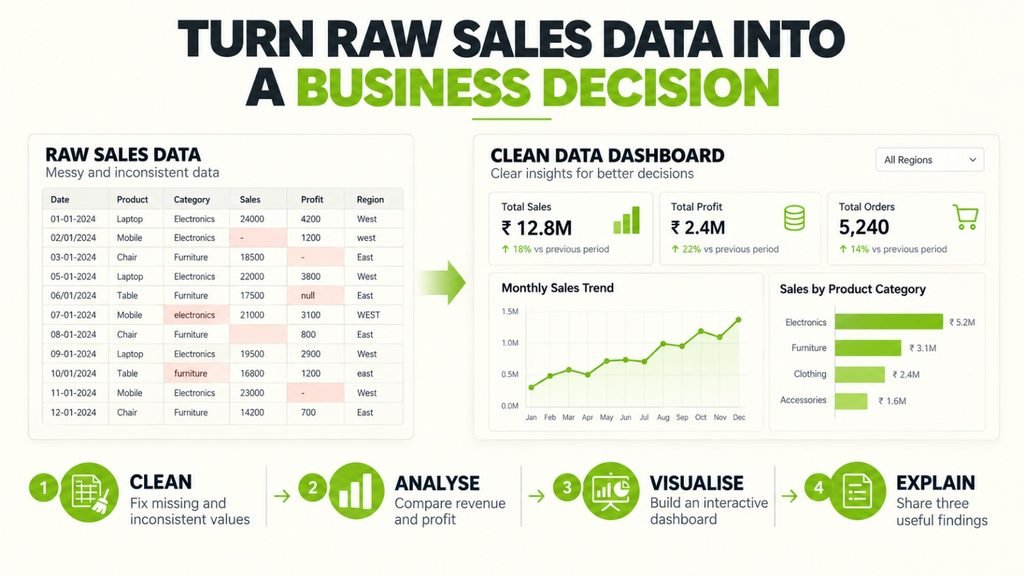
Watching tutorials feels productive, but building something is where learning happens. Whichever tool you pick, try this starter project with a retail sales dataset:
- Clean the data. Look for missing values and inconsistent entries.
- Dig into the numbers. Check monthly revenue, product categories, and regional performance.
- Create measures. Build sales, profit, and month-on-month change where it makes sense.
- Build a dashboard with filters so people can explore it.
- Write your takeaways. Three business observations and one recommendation.
That last step is the one most beginners skip, and it’s the one interviewers care about. A good portfolio isn’t just pretty charts. It shows how you prepared the data, why you picked those metrics, and what you think the results mean.
For the tool-specific steps, the official learning resources are a solid place to start: Microsoft Learn for Power BI and Tableau’s own learning material for Tableau.
What Else Should You Learn Alongside Power BI or Tableau?
The tool is one piece of the puzzle. Here’s the rest of the toolkit:
- Excel: sorting, formulas, pivot tables and basic analysis.
- SQL: querying, filtering, joining and aggregating data.
- Data cleaning: spotting errors, gaps and messy formats.
- Statistics: averages, distributions, trends and comparisons.
- Data visualisation: picking charts that answer the actual business question.
- Communication: explaining your findings to people who don’t live in data all day.
Exactly what you need depends on the role. But no tool, however good, replaces understanding the data in front of you. If you’re still deciding which kind of analytics role suits you, read FirstBit’s guide to Data Analyst vs Data Scientist to understand how their responsibilities and technical skills differ.
Learn Power BI and Tableau as Part of Your Data Analytics Training
If you’d rather not stitch together random tutorials and hope they add up, structured training can save you a lot of confusion. A good programme teaches the tools along with the analytical thinking behind them, and gives you projects to practise on.
Want to learn in a more guided way? Explore FirstBit Solutions’ Data Analytics course in Pune and go through the full syllabus, the practical projects, the teaching format, and the prerequisites. That way, you can see exactly which tools are covered and whether the training fits your goals.